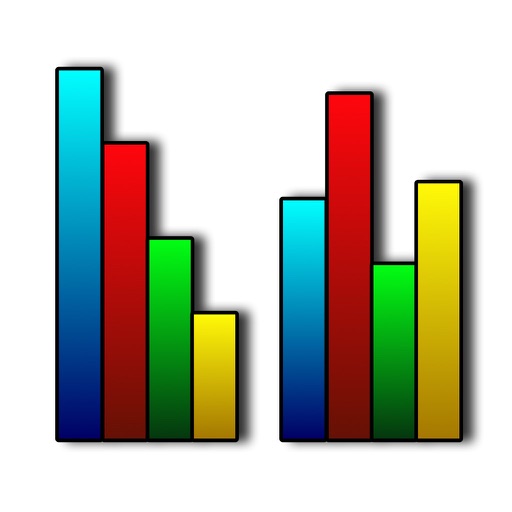


Bar Diagrams by iMathics


Bar Diagrams by iMathics is a mobile graphing utility for creating bar and line charts on iOS devices.
The App DNA
What makes this app unique?
The app removes the cognitive friction of spreadsheet software for users who need to visualize simple data sets quickly on a mobile device.
For Users needing a simple, mobile-first tool for creating and presenting basic bar and line charts.
What does it look like?
Key features
Manual input interface for defining chart data points and labels.
Visualizes data updates in real-time while editing table rows and columns.
Enables hard-copy output of diagrams directly from the device via AirPrint.
How much does it cost?
The freemium model gates physical output behind a one-time in-app purchase, keeping core creation tools free.
Velocity
Dormant developmentnew contentShow more...
Bar Diagrams by iMathics has been inactive for 4,140 days. The development history consists of a single release that introduced a new chart type. There is no evidence of ongoing maintenance, feature updates, or operational support for the application.
Who built it?
Alexandra Hamburg
2 apps tracked · Business
 Pie Diagrams by iMathics
User Sentiment
What do users think recently?
Fresh user feedback skews mixed. Users appreciate simple graphing tools provide a straightforward way for users to visualize personal data progression over time and nostalgic users appreciate the developer keeping the application alive for long-term use across many years.
How are ratings & reviews evolving?
What users say, by theme
- Simple graphing tools provide a straightforward way for users to visualize personal data progression over time
- Nostalgic users appreciate the developer keeping the application alive for long-term use across many years
- Frequent application crashes during data entry and graph viewing frustrate users and cause significant data loss
17 of 17 recent reviews analyzed · moderate confidence · Mixed overall
Read the full review analysisUnlock 1 more frustration theme and 1 user request, each backed by review evidence.
Access the full report for freeCompetition
Competitive landscape for Bar Diagrams by iMathics
How's the Business market?
Bar Diagrams by iMathics occupies a legacy position in the Business category, with no updates since 2015. The 3.6-star rating across 13 ratings reflects a mixed user base that values simplicity but is frustrated by technical instability.
The rivals identified
The Analyst's Read
Key takeaways for Bar Diagrams by iMathics
Where is it heading?
The market for simple mobile charting is consolidating around tools that offer cloud sync and modern export formats. Bar Diagrams by iMathics is currently exposed due to its lack of development, and without a shift toward modern export features, it will continue to lose utility for professional users.
- The 11-year update gap indicates the app is in maintenance mode, which increases the risk of total failure on future iOS builds.
- Frequent crash reports during data entry erode user trust, leading to churn among the remaining loyal user base.
The SWOT
- Simple, intuitive data entry interface supports quick visualization of personal progress.
- Implementing standard image export (PNG/PDF) would address the primary user request for sharing charts.
Next best moves
Audit and fix crash triggers during data entry because users report frequent data loss → restore basic stability.
+ 1 more prioritized moveThe counter-intuitive read
The app's long-term survival is a liability, not an asset…
Read the full takeBottom line
Bar Diagrams by iMathics remains a legacy utility that serves a niche for simple, manual graphing. Addressing the persistent crash reports and adding standard image export would stabilize the user experience, as the current technical instability prevents the app from being a reliable tool.
Unlock 2 critical frictions, 1 market threat, 1 more prioritized move and the analyst’s take.
Access the full report for freeSources
- [1] App Store
Report last updated