


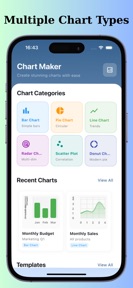

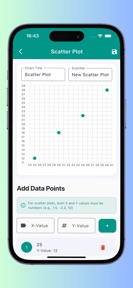

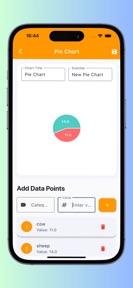


Chart Maker - Build Graphs is a productivity tool for creating and storing professional charts on iOS and Android.
The App DNA
What makes this app unique?
Users hire this app for rapid, low-friction data visualization in reports and presentations without needing complex software.
For Students, teachers, business professionals, and data analysts requiring quick, visual data representation.
What does it look like?
Key features
Generates Line, Bar, Donut, Scatter, and Radar graphs from user-inputted data points.
Stores previous chart designs for editing or future project reuse.
Provides pre-designed layouts for rapid chart generation.
How much does it cost?
The app operates as a free, ad-supported tool with no visible IAP or subscription gates.
Velocity
Dormant developmentopaqueShow more...
The app has entered a zombie state, with no updates released in the last 349 days. The only recorded version, 1.0.0, was a minor bug fix release. There is no evidence of active development, feature expansion, or ongoing maintenance for either the Android or iOS platforms.
Who built it?
MUSTAFA ACAR
3 apps tracked · Productivity
 Digital Detox App Blocker
 All in One Digital Planner
User Sentiment
What do users think recently?
Recent user voice shows a thrilled sentiment. Users appreciate the application provides a pleasant and satisfying user experience for those engaging with the current build.
How are ratings & reviews evolving?
What users say, by theme
- The application provides a pleasant and satisfying user experience for those engaging with the current build
1 of 1 recent reviews analyzed · limited sample
Read the full review analysisCompetition
Competitive landscape for Chart Maker - Build Graphs
How's the Productivity market?
The app maintains a basic productivity footprint with a 3-star rating on iOS. The lack of updates since August 2025 signals a low-intensity market posture compared to active category leaders.
Read the market outlookThe rivals identified
Unlock the deeper market read.
Access the full report for freeThe Analyst's Read
Key takeaways for Chart Maker - Build Graphs
Where is it heading?
The productivity visualization market is consolidating around tools that offer cross-platform sync and collaborative features. This app remains in maintenance mode, which will likely lead to a gradual decline in user engagement as more active competitors capture the professional segment.
- The 11-month update silence indicates a maintenance-mode posture, which accelerates churn risk as competitors ship feature-rich updates to capture productivity users.
The SWOT
- Multi-chart library supports diverse data visualization needs
- Reusability feature increases switching costs via personal design libraries
- Education partnerships could serve as a B2B distribution barrier
- Wearable integration remains an untapped segment for quick data checks
Next best moves
Ship cloud-sync because it is a standard productivity requirement for professional users → unlock retention.
+ 1 more prioritized moveThe counter-intuitive read
The app's lack of monetization is its biggest threat…
Read the full takeSince the last report: The analysis has evolved to prioritize the identification of monetization and feature gaps, specifically highlighting the lack of IAP and cloud-sync as primary inhibitors to professional utility.
Bottom line
Chart Maker provides a functional, free tool for basic visualization, but the lack of updates since August 2025 creates a churn risk against active rivals, so the PM should prioritize a feature-parity roadmap to maintain relevance.
Unlock 2 critical frictions, 2 market threats, 1 more prioritized move and the analyst’s take.
Access the full report for freeSources
- [1] App Store, source
Report last updated