




Electricity Maps is a utility platform for tracking real-time and historical electricity grid data, carbon intensity, and energy prices across global regions.
The App DNA
What makes this app unique?
The platform removes the friction of aggregating fragmented, multi-source energy data for sustainability professionals and traders, replacing manual research with a unified API and visualization layer.
For Sustainability professionals, energy traders, and data-driven enterprises seeking granular grid and carbon intensity insights.
What does it look like?
Key features
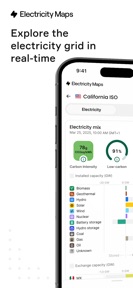
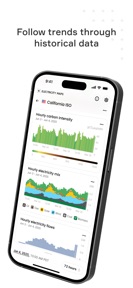
Interactive visualization of electricity production and carbon intensity by geographic zone, driving brand authority and B2B leads.
Programmatic access to historical and live grid signals, serving as the primary revenue driver for enterprise sustainability reporting.
Predictive modeling for energy prices and grid fundamentals, justifying enterprise-level pricing for energy traders.
How much does it cost?
The freemium model uses a free public-facing map to build brand authority while gating granular data and forecasting tools behind enterprise API contracts.
Velocity
Maintenance developmentUX improvementsperformanceShow more...
Electricity Maps is currently in a maintenance phase, with only two releases identified in the recent window. The latest release occurred 110 days ago, and the overall cadence averages roughly one update every 3-4 months. Development is focused exclusively on minor technical refinements and platform-specific navigation fixes rather than new feature expansion. The current release frequency suggests a stable, low-intensity maintenance cycle.
Who built it?

User Sentiment
What do users think recently?
Fresh user feedback skews excited. Users appreciate extensive global energy generation data provides high educational value for users tracking climate change impacts and clean visual interface makes complex energy production and consumption data easy to navigate for casual users, but report recent ui changes make the app less user friendly and increase interaction friction during daily use.
How are ratings & reviews evolving?
What users say, by theme
- Extensive global energy generation data provides high educational value for users tracking climate change impacts
- Clean visual interface makes complex energy production and consumption data easy to navigate for casual users
- Recent UI changes make the app less user friendly and increase interaction friction during daily use
50 of 50 recent reviews analyzed · high confidence · Excited overall
Read the full review analysisUnlock 1 more frustration theme and 2 user requests, each backed by review evidence.
Access the full report for freeCompetition
Competitive landscape for Electricity Maps
How's the Utilities market?
Electricity Maps maintains a steady presence in the Utilities category with a 4.6-star rating across 1,085 total platform reviews. The lack of major feature updates in the last 110 days suggests a focus on maintenance rather than aggressive market share expansion.
Read the market outlookThe rivals identified
Unlock the deeper market read.
Access the full report for freeThe Analyst's Read
Key takeaways for Electricity Maps
Where is it heading?
The energy data market is consolidating around tools that offer seamless cross-device parity, and Electricity Maps' current maintenance-only cadence leaves it exposed to mobile-first entrants. Addressing the mobile interface friction is necessary to prevent the erosion of the casual user base that feeds the brand's top-of-funnel authority.
- The 110-day gap since the last update indicates a maintenance-only posture, which risks losing mobile users to more responsive, frequently updated data tools.
- The consistent 4.6-star rating suggests the core data utility remains high, even as recent interface regressions create friction for the mobile user base.
The SWOT
- Interactive grid visualization drives organic brand authority
- API-first architecture creates high switching costs for enterprise users
- Localized energy-mix forecasting for emerging markets
- Integration of total consumption lines into production graphs
Next best moves
Rebuild mobile text scaling logic because tiny text makes the app unusable on small screens → improve retention
+ 1 more prioritized moveThe counter-intuitive read
The lack of mobile-first optimization is a strategic…
Read the full takeSince the last report: The platform has entered a stable maintenance phase with no new feature deployments, shifting focus toward addressing mobile usability deficits that drive users to the web-based alternative.
Bottom line
The current maintenance-mode cadence leaves Electricity Maps vulnerable to mobile-first competitors, as the recent update introduced interface friction that drives users to the web version. Prioritizing mobile usability would protect the user base while the enterprise API continues to drive revenue.
Unlock 3 critical frictions, 2 market threats, 1 more prioritized move and the analyst’s take.
Access the full report for freeFAQ
Is Electricity Maps free to use?
Can I use Electricity Maps on my phone?
What is the difference between the free map and the API?
Sources
- [1] Play Store listing, source
Report last updated