


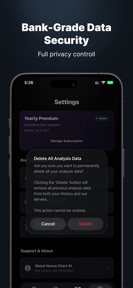
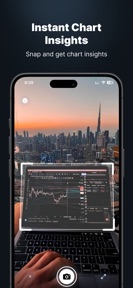

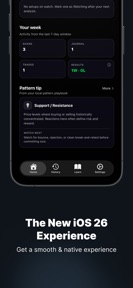


Nexus: Chart Analysis, Trading is a mobile utility that generates technical analysis and trade signals from user-uploaded chart images across stock, forex, and crypto markets.
The App DNA
What makes this app unique?
The app removes the cognitive friction of manual technical indicator interpretation, allowing retail traders to generate entry and exit guidance without deep prior expertise.
For Retail traders across stock, forex, and crypto markets seeking automated technical analysis and performance tracking.
What does it look like?
Key features
Automated trend detection and buy/sell/hold signals generated from user-captured chart images
Logging tool for tracking trade outcomes, notes, and weekly win/loss statistics
Educational guides for 26 patterns and indicators including RSI, MACD, and Bollinger Bands
How much does it cost?
The strict weekly volume cap on the free tier acts as a direct conversion lever for high-frequency traders.
Velocity
Maintenance developmentmonetizationUX improvementsShow more...
Nexus: Chart Analysis, Trading currently operates at a maintenance cadence, averaging one release every 70 days. Development is infrequent, with the latest release introducing a 'Spin to Win' reward mechanic alongside minor bug fixes. There is no evidence of a high-frequency feature pipeline or active live-ops rotation. The current trend suggests a focus on stability and basic user retention rather than rapid feature iteration.
Who built it?
GRE Development
3 apps tracked · Finance
 Nexus: Chart Analysis, Trading
 ايليا – فضائل علي بن أبي طالب
User Sentiment
What do users think recently?
How are ratings & reviews evolving?
Not enough recent reviews to extract reliable themes yet.
Read the full review analysisCompetition
Competitive landscape for Nexus: Chart Analysis, Trading
How's the Finance market?
Nexus: Chart Analysis, Trading operates as a niche utility in the Finance category. With 0 ratings across platforms, the app lacks the social proof required to compete with established trading assistants, signaling a need for aggressive user acquisition to validate the AI model's accuracy.
The rivals identified
The Analyst's Read
Key takeaways for Nexus: Chart Analysis, Trading
Where is it heading?
Users report: The retail trading utility market is consolidating around platforms that offer integrated, real-time data. Nexus: Chart Analysis, Trading remains exposed due to its reliance on static image processing and a lack of active development, which will likely result in stagnant user growth through the next quarter.
- The latest release introduced gamified rewards, which suggests an attempt to boost session frequency without addressing the core signal-reliability feedback loop.
- A 70-day gap since the last update indicates a lack of active feature investment, which limits the app's ability to respond to market volatility.
The SWOT
- AI-driven pattern recognition lowers technical barrier to entry for retail traders
- Localized pricing could capture untapped high-ARPU markets in the crypto-trading segment
Next best moves
A/B test a higher free-tier analysis limit because the current 3-analysis cap is a primary conversion barrier → increase top-of-funnel conversion
+ 1 more prioritized moveThe counter-intuitive read
The app's maintenance-mode status is a strategic advantage…
Read the full takeBottom line
Nexus: Chart Analysis, Trading must pivot its free-tier volume strategy to lower the barrier for casual traders, as the current cap prevents the necessary usage volume to build trust in the AI model.
Unlock 1 critical friction, 1 market threat, 1 more prioritized move and the analyst’s take.
Access the full report for freeSources
- [1] App Store, source
Report last updated