




Easy Chart is a utility app for creating bar, line, and pie charts on iOS.
The App DNA
What makes this app unique?
Users hire Easy Chart for quick, offline data visualization without the complexity of spreadsheet software.
For Casual users needing a simple, offline tool to visualize data for personal use or social sharing.
What does it look like?
Key features
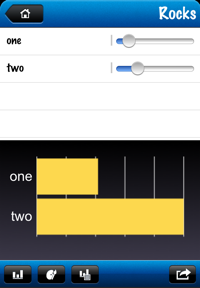
Generates bar, line, pie, and sidebar charts from user-input data.
Enables chart creation and editing without an active internet connection.
Unlocks social media sharing and additional customization via in-app purchase.
How much does it cost?
Freemium model gates advanced customization and social sharing features behind a one-time in-app purchase.
Velocity
Dormant developmentopaqueShow more...
Easy Chart has been inactive for over 15 years, with no updates or maintenance releases since June 2011. The development momentum is non-existent, and the app is classified as a zombie project. There is no evidence of ongoing support or feature development.
Who built it?
User Sentiment
What do users think recently?
Fresh user feedback skews frustrated. Users appreciate simple and intuitive interface allows users to create basic charts without complex setup requirements and free pricing model provides high value for users needing basic data visualization tools.
How are ratings & reviews evolving?
What users say, by theme
- Simple and intuitive interface allows users to create basic charts without complex setup requirements
- Free pricing model provides high value for users needing basic data visualization tools
- Frequent application crashes during data entry lead to total loss of user progress
32 of 32 recent reviews analyzed · high confidence · Frustrated overall
Read the full review analysisUnlock 2 more frustration themes and 1 user request, each backed by review evidence.
Access the full report for freeCompetition
Competitive landscape for Easy Chart
How's the Utilities market?
Easy Chart maintains a legacy presence in the Utilities category with a 2.56-star rating across 25 reviews. The lack of updates since 2011 signals a sunset posture, leaving the app vulnerable to modern, actively maintained visualization tools.
Read the market outlookThe rivals identified
Unlock the deeper market read.
Access the full report for freeThe Analyst's Read
Key takeaways for Easy Chart
Where is it heading?
The app is in a terminal state due to a total lack of maintenance since 2011. Without an immediate stability refresh, the app will continue to lose its remaining user base to modern, actively supported visualization alternatives.
- The 15-year update gap causes performance degradation on modern hardware, which compounds the negative sentiment already visible in user reviews.
The SWOT
- Offline-first architecture enables data visualization without network access
- Implementing automated summation and averaging would address top user requests
Next best moves
Audit crash logs because frequent data-entry crashes are the top user complaint → restore baseline stability
The counter-intuitive read
The app's 15-year silence is not just a neglect issue…
Read the full takeSince the last report: The intelligence report reflects a shift in the recommended product strategy from sunsetting the app to auditing crash logs, while the underlying product remains in a stagnant, unmaintained state.
Bottom line
Easy Chart provides a functional offline visualization tool, but the 15-year maintenance gap causes frequent crashes that destroy user progress, so the developer must prioritize stability fixes before attempting any feature expansion.
Unlock 2 critical frictions, 1 market threat and the analyst’s take.
Access the full report for freeSources
- [1] App Store, source
Report last updated